
Press
Press releases - 2015 Global Open Data Index shows decline in overall percentage of open datasets
9th December 2015
OPEN KNOWLEDGE INTERNATIONAL PUBLISHES GLOBAL OPEN DATA INDEX 2015, TRACKING THE STATE OF OPEN DATA WORLDWIDE
Open Knowledge International has published the Global Open Data Index 2015, showing that countries outside of Europe, the US & Canada have made some impressive gains in releasing key data. However, progress remains slow for most governments, who are still not providing key information in an accessible formats to be used, without restriction, by their citizens, civil societies, journalists and businesses.
http://2015.index.okfn.org/ Pavel Richter, CEO at Open Knowledge International, said:
"It should be a priority for all governments to publish relevant data timely and openly, so that it can be used by anyone for any purpose. This is crucial for citizens and organisations to be able to hold governments to account and to innovate. While there is a lot of enthusiasm within governments for open data, the Global Open Data Index 2015 shows that this enthusiasm does not sufficiently translate into meaningful action: Key data is still not being released to the standard that is required. We call upon governments to evaluate their priorities and make sure they publish the data that their citizens need."
The Global Open Data Index is the result of civil society collaboration to track the state of open data in countries and places around the world. This tool is used by some governments to set their open data priorities, and by civil society actors as an advocacy mechanism to encourage governments to improve their performance in releasing key datasets. The Index ranks countries based on the availability and accessibility of data in thirteen key categories, including government spending, election results, procurement, and pollution levels. We held a public consultation which saw contributions from individuals within the open data community as well as from key civil society organisations across an array of sectors. As a result of this, we expanded the 2015 Index to include procurement data, water quality data, land ownership data and weather data; we also removed transport timetables due to the difficulties faced when comparing transport system data globally.
Some key findings of the Global Open Data Index 2015 are:
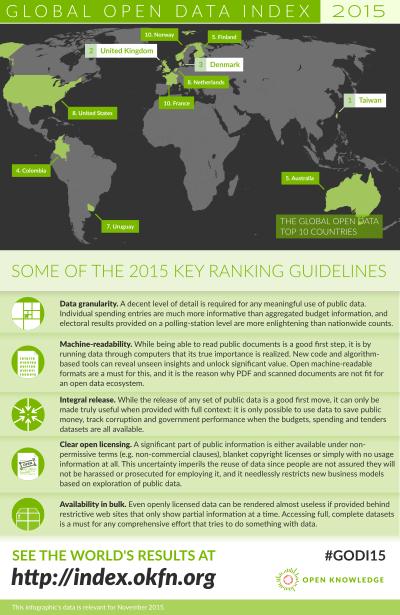
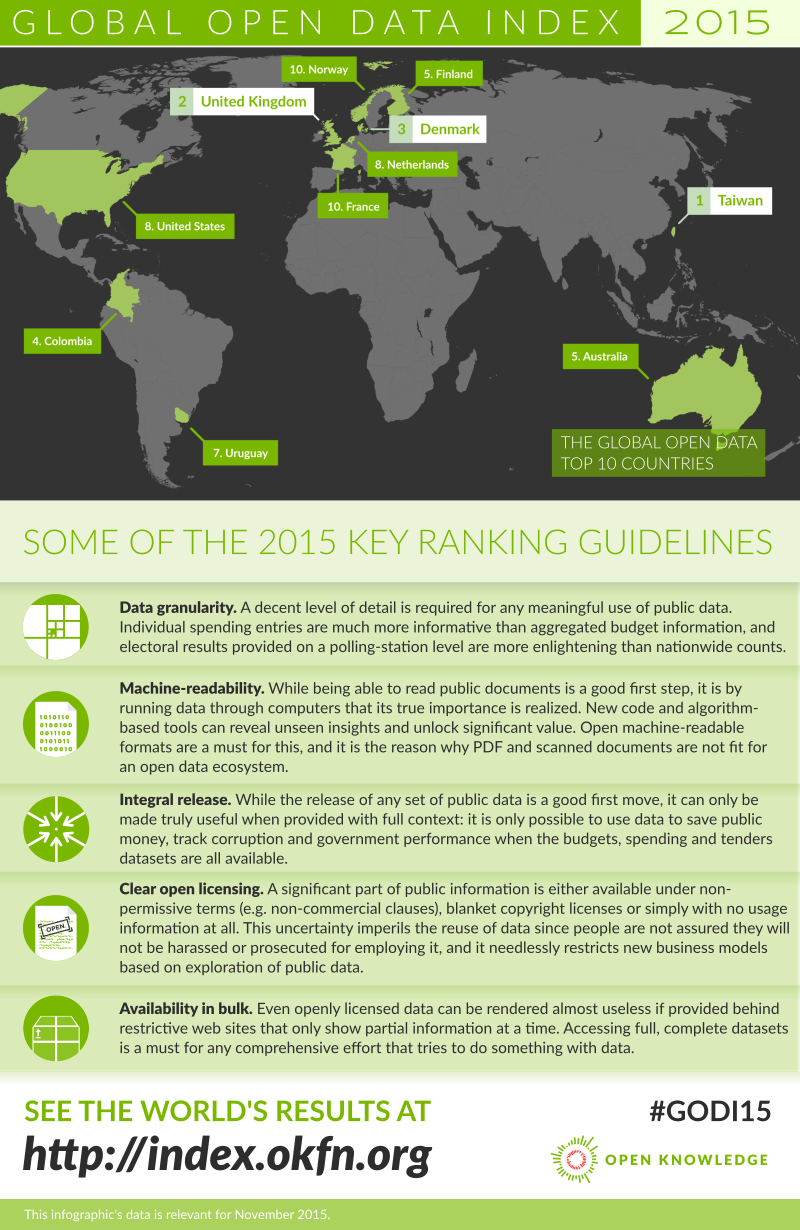
- Taiwan topped the Index for the first time this year becoming the first non-European country to place in the top three. Nevertheless, significant progress is still to be made as Taiwan’s overall score reveals that their data is only 78% open. Crucial datasets such as government spending, postcodes & land ownership are still closed and inaccessible to citizens.
- The UK fell to second place for the first time in this year’s ranking with an overall score of 76%, down from 96% last year. This year’s fall in score is due largely to the 2015 dataset definitions in categories such as election results requiring more granular data and the inclusion of data on water quality and land ownership, both of which are closed in the UK.
- While the top rankings in the Index remained dominated by OECD countries, for the first time three non-OECD countries placed were able to break into the top ten with Taiwan placing first, Colombia placing fourth and Uruguay placing seventh.
- For the third year running, the most open dataset globally is national statistics and the least open is government spending, with Greece being the only country to publish 100% open data for transactional government spending.
- Overall, whilst there was meaningful improvement in the number of open datasets (from 124 to 154), the percentage of open datasets across all the surveyed countries fell from 11% in 2014 to 9% in 2015. Furthermore, as the scope of the Index increased significantly, surveying 122 rather than 97 countries across 13 rather than 10 dataset categories, it is clear that little progress has been made at the global level.
For more information, please contact: press@okfn.org
Infographics
